This is a very simple analysis of the responses to the survey that was distributed as part of the SOISE research mapping activity, taking place in May 2021. Staff were asked to comment on a range of topics including their theories, methodologies, impact, motivations and collaborative endeavours. These responses were used as a starting point for further discussions held in clusters. In addition, at the conclusion of these cluster meetings, the responses to the surveys were analysed as described below, with the aim of providing a starting point for the development of actionable insights for the School and Faculty Executive.
This analysis was performed by Keith Heggart. Keith is grateful to Dr Kirsty Young for providing him this opportunity.
Methodological Commentary
A number of methodological considerations have informed the analysis and presentation of the results. These are briefly documented below.
- In order to process the data, the survey responses were organised by question (theories, methodologies, motivations, impact, funding and collaborations) and pasted into text files.
- The questions about publications and outputs were not included. Their nature (lists of journals and NTROS) had already been analysed, and limited commonality was found, so I chose to exclude them. It would be easy to re-include them should further analysis be required.
- These text files were then imported into R Studio, using the ReadLines() function, which imports the files on a line by line basis (as opposed to ReadCSV() which try to delimit the import).
- Using the tm library, the text files were converted to corpuses, which were then processed in the following way:
- – Non-significant characters (e.g.“/”, “@” and “|” ) were replaced with white space.
- – Text was converted to lower case (to prevent confusion regarding “Qualitative” and “qualitative”,for example).
- – Numbers were removed. This could potentially affect the analysis where someone has written 2instead of two, but I don’t think this is significant in the corpus.
- – Common stopwords were removed. This is done using a list in the tm library of common Englishstopwords.
- – Common stopwords were removed. This is done using a list in the tm library of common Englishstopwords.
- – Punctuation was removed
- – Extra white spaces, including those added in the first processing step were removed.
- – Words were stemmed – that is, reduced to their root form. This is an important step becauseit means that we are more likely to be able to count multiple occurrences of similar works – e.g
interview and interviews.
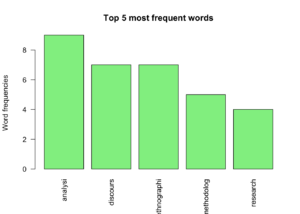
- Following this, a Term Document Matrix was created, which presents each term (or word) and the frequency that it appeared in the corpus.
- This was used to generate a bar chart showing the frequency of the five most common words.
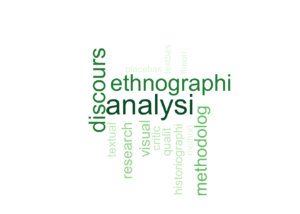
- In addition, a word cloud and a correlation chart was produced.I am reasonably inexperienced in this process, so there may be some errors in this process. Any errors are mine alone.