Introduction
So this is a little passion project of mine that combines two of my interests (even passions) at the moment – cricket and the analysis of data. I’d hardly be the first to note the links between data and elite sport, but this is my first foray beyond armchair spectating, so I am keen to see how it will work out.
My Hypothesis
There has been an increase in the number of sixes in winning teams in the BBL since the start of the format.
Getting the data
There are plenty of data sources about cricket already out there. The best one I found was cricsheet (https://cricsheet.org) which has ball by ball data for almost every cricket game that is out there at the moment. It is mostly in YAML format, but I was able to also download a CSV. This came as a zipped file, with each game as an individual csv and also all games combined into one CVS. It’s reasonably straightforward to convert this into an excel workbook and then import it into R.
Importing the Data
library(readxl)

all_matches <- read_excel("~/Dropbox/Keith/Technology/R Projects/Cricket Data/all_matches.xlsx")

View(all_matches)
Processing the data
The data is incredibly comprehensive. Every row is a ball in every single BBL match. It describes the ground, the game, who is playing, who is bowling, and so on. Here’s what I am trying to work out.
- When was the game played?
- Who won the game?
- How many sixes were hit by the winning team?
- How many sixes were hit by the losing team?
Counting the data
library(tidyverse)

# It does give me an idea for how we could count up using the match-id
# So 2016/2017 season starts at 1023625
# We can filter the data and save it as follows.

season2011_2012 <- all_matches %>% filter(all_matches$season == '2011/12')
season2012_2013 <- all_matches %>% filter(all_matches$season == '2012/13')
season2013_2014 <- all_matches %>% filter(all_matches$season == '2013/14')
season2014_2015 <- all_matches %>% filter(all_matches$season == '2014/15')
season2015_2016 <- all_matches %>% filter(all_matches$season == '2015/16')
season2016_2017 <- all_matches %>% filter(all_matches$season == '2016/17')
season2017_2018 <- all_matches %>% filter(all_matches$season == '2017/18')
season2018_2019 <- all_matches %>% filter(all_matches$season == '2018/19')
season2019_2020 <- all_matches %>% filter(all_matches$season == '2019/20')
season2020_2021 <- all_matches %>% filter(all_matches$season == '2020/21')

boundaries_per_year <- function(season_year, season_scores) {
  #season2011_2012$season[1]
  #season2011_2012$runs_off_bat
  sixes_count <- 0
  fours_count <- 0

  for (item in season_scores) {
    if (item == 6) {
      sixes_count = sixes_count + 1
    }
    if (item == 4) {
      fours_count = fours_count + 1
     }
  }

  print(paste("The Year is", season_year))
  print(paste("Total Sixes: ", sixes_count))
  print(paste("Total Fours: ", fours_count))
}

boundaries_per_year(season2011_2012$season[1], season2011_2012$runs_off_bat)
boundaries_per_year(season2012_2013$season[1],season2012_2013$runs_off_bat)
boundaries_per_year(season2013_2014$season[1],season2013_2014$runs_off_bat)
boundaries_per_year(season2014_2015$season[1],season2014_2015$runs_off_bat)
boundaries_per_year(season2015_2016$season[1],season2015_2016$runs_off_bat)
boundaries_per_year(season2016_2017$season[1],season2016_2017$runs_off_bat)=
boundaries_per_year(season2017_2018$season[1],season2017_2018$runs_off_bat)
boundaries_per_year(season2018_2019$season[1],season2018_2019$runs_off_bat)
boundaries_per_year(season2019_2020$season[1],season2019_2020$runs_off_bat)

df <- select(season2011_2012, runs_off_bat, batting_team)
view(df)
# Okay the below function (boundaries_per_team) seems to work. But I need to start appending it to a data frame so that I have the answers at the end.
Creating a Tibble
# Let’s start by creating a tibble with each year.
final <- tibble("2011/2012", "2012/2013", "2013/2014", "2014/2015", "2015/2016", "2016/2017", "2017/2018", "2018/2019", "2019/2020")

boundaries_per_team <- function(season) {

  #season2011_2012$season[1]

  #season2011_2012$runs_off_bat

  hurricanes_sixes_count <- 0

  hurricanes_fours_count <- 0

  thunder_sixes_count <- 0

  thunder_fours_count <- 0

  sixers_sixes_count <- 0

  sixers_fours_count <- 0

  sixes_count <- 0

  fours_count <- 0


  working_frame <- select(season, runs_off_bat, batting_team)


  for (row in 1:nrow(working_frame)) {

    runs <- working_frame[row, "runs_off_bat"]

    team  <- working_frame[row, "batting_team"]


    if (runs == 6) {

      sixes_count = sixes_count + 1

    }


    if (runs == 4) {

      fours_count = fours_count + 1

    }


    if (runs == 6 && team == "Hobart Hurricanes") {

      hurricanes_sixes_count = hurricanes_sixes_count + 1

    }


    if (runs == 4 && team == "Hobart Hurricanes") {

      hurricanes_fours_count = hurricanes_fours_count + 1

    }


    if (runs == 6 && team == "Sydney Thunder") {

      thunder_sixes_count = thunder_sixes_count + 1

    }


    if (runs == 4 && team == "Sydney Thunder") {

      thunder_fours_count = thunder_fours_count + 1

    }

    if (runs == 6 && team == "Sydney Sixers") {

      sixers_sixes_count = sixers_sixes_count + 1

    }


    if (runs == 4 && team == "Sydney Sixers") {

      sixers_fours_count = sixers_fours_count + 1

    }

  }

  print(paste("The Year is", season$season[1]))
  print(paste("Sixes: ", sixes_count))
  print(paste("Fours: ", fours_count))
  print(paste("Hurricane Sixes: ", hurricanes_sixes_count))
  print(paste("Hurricane Fours: ", hurricanes_fours_count))
  print(paste("Thunder Sixes: ", thunder_sixes_count))
  print(paste("Thunder Fours: ", thunder_fours_count))
  print(paste("Sixers Sixes: ", sixers_sixes_count))
  print(paste("Sixers Fours: ", sixers_fours_count))
  #try to create a tibble here
  column_headers <- c("Year", "Sixes", "Fours", "Hurricane Sixes", "Hurricane Fours", "Thunder Sixes", "Thunder Fours", "Sixers Sixes", "Sixers Fours")
  column_values <- c(season$season[1], sixes_count, fours_count, hurricanes_sixes_count, hurricanes_fours_count, thunder_sixes_count, thunder_fours_count, sixers_sixes_count, sixers_fours_count)

  year_tibble <- tibble(Year = season$season[1],
                        Sixes = sixes_count,
                        Fours = fours_count,
                        Hurricane_Sixes = hurricanes_sixes_count,
                        Hurricane_Fours = hurricanes_fours_count,
                        Thunder_Sixes = thunder_sixes_count,
                        Thunder_Fours = thunder_fours_count,
                        Sixers_Sixes = sixers_sixes_count,
                        Sixers_Fours =sixers_fours_count)

  return(year_tibble)
}

first_tibble <- boundaries_per_team(season2011_2012)
second_tibble <- boundaries_per_team(season2012_2013)
third_tibble <- boundaries_per_team(season2013_2014)
fourth_tibble <- boundaries_per_team(season2014_2015)
fifth_tibble <- boundaries_per_team(season2015_2016)
sixth_tibble <- boundaries_per_team(season2016_2017)
seventh_tibble <- boundaries_per_team(season2017_2018)
eight_tibble <- boundaries_per_team(season2018_2019)
ninth_tibble <- boundaries_per_team(season2019_2020)
combo = bind_rows(first_tibble,second_tibble, third_tibble, fourth_tibble, fifth_tibble, sixth_tibble, seventh_tibble, eight_tibble, ninth_tibble)
Exporting the data to Tableau
install.packages("writexl")
library(writexl)
data <- write_excel("~/Dropbox/Keith/Technology/R Projects/Cricket Data/sixes.xlsx")
write_xlsx(combo,"~/Dropbox/Keith/Technology/R Projects/Cricket Data/sixes.xlsx")
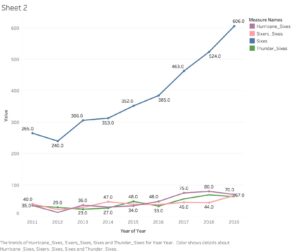
The result from Tableau