This is part of an ongoing program of working with social media data analysis and a range of tools to analyse, including InstaCrawlR, R and Gephi. It’s very much a learning process and a work in progress. I’m documenting my progress here as I try out different methodologies, tools and approaches so that I can return to my work if I need to do so.
In my last project, I thought I had managed to make everything work correctly, but it didn’t appear to export degree correctly, which will probably influence the final result. So I am going to try again, with a set of different data.
I’m going to look at some teacher hashtags on instagram and see what develops from there. In the first instance, I will try to make a network graph with the following three graphs.
Useful Resources:
These are some of the resources that I am going to be using and have influenced my work.
- InstaCrawlR: https://github.com/JonasSchroeder/InstaCrawlR/blob/master/InstaCrawlR%20Instructions.pdf
- Open CSV with Excel by default: https://www.resrequest.com/blog/how-to-open-csv-files-with-excel-by-default/
- Settings in Gephi: https://duo.com/blog/mapping-social-networks-with-gephi
Hashtags from Instagram that I am scraping:
I’m interested in the agreement of hashtags on Instagram. In that order, I am going to scrape the following hashtags
- #teachersofinstagram
- #teachers
- #teachersfollowteachers
Process in R
I’m going to start off with #teachersofinstagram.
- Using jsonReader with that hashtag
I ran the scraping until we get 1500 posts. I will need to fix the timezone. This is pretty straightforward. I configure the script in R, run it and it works as you’d expect. The output is a CSV that I can then use in R Studio. There are some issues – it looks like it struggles with unusual characters, especially apostrophes and emojis.
- Now using hashtagExtractor.R
The next step is to extract the hashtags from the CSV file. Again, this runs reasonably straightforward, after noting the separator needs to be changed to , rather than default. There was a slight problem with the columns not lining up I had to change column 5 to 6 in the function to make sure that it specified the correct column. I exported this to CSV again
- graphCreator.R
The third script in InstaCrawlR is called graphCreator. What this does is create the graph object that can then be exported to Gephi for further analysis. In particular it builds node and edge lists.
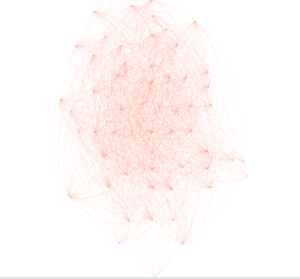
- g2gephi.R
To export the program in a gephi compatible format, it’s necessary to run the final program from InstaCrawlR. In order to do this, I set the degree to 80, and then left it running for a long time. This led to the falling plots
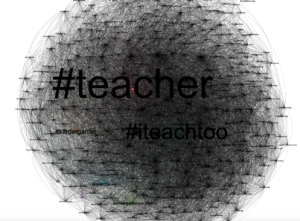
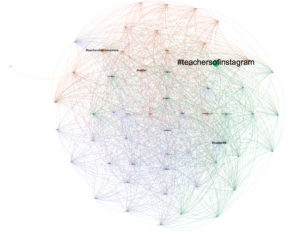
Process in Gephi
Having imported it into Gephi, I then spent a bit of time playing with it and configuring it in Gephi. This resulted in the visualisation below. One of the key things here is the way I lay out the information, and also the number of nodes and edges I show. I also think it’s interesting to consider how to cluster the information, too – see the third diagram.